There is a number that matters in American education, and it lives in two places at once. In Iowa, that number is 72 percent the share of eighth graders deemed proficient in math by the state's own assessment in 2024. Across the same classrooms, sitting the same year, the National Assessment of Educational Progress reported something very different: just 27 percent of Iowa's eighth graders met that same proficiency threshold. The gap between those two figures is 45 percentage points. It is not a rounding error. It is the honesty gap.
Two Scales, Two Numbers, One Reality
The honesty gap has become one of the most consequential concepts in education policy, though it moves quietly through reports, spreadsheets, and legislative testimony without fanfare. At its core, it is a comparison: how students perform on the national gold-standard assessment, known as NAEP, against how they perform on their own state's tests. When those two numbers diverge significantly, parents, employers, and policymakers face a choice about which truth to believe and increasingly, that choice is being made for them by the language of the benchmarks themselves.
The term has roots in education reform circles, where analysts first began systematically comparing state proficiency definitions against national baselines. A brief from the U.S. Chamber of Commerce Foundation frames it plainly: the honesty gap measures the difference between how students perform on the national assessment and how they perform on their own state's tests. When states lower the bar for proficiency, achievement data can paint a misleading picture one that affects students, parents, educators, and ultimately the workforce.
This is not a new problem. More than fifteen years ago, analysts Checker Finn and Mike Petrilli warned about these dangers in their introduction to The Proficiency Illusion, noting that America was already "awash in achievement 'data,' yet the truth about our educational performance is far from transparent and trustworthy." They described a landscape where "gains (and slippages) may be illusory. Comparisons may be misleading. Apparent problems may be nonexistent or, at least, misstated." The testing infrastructure on which so many school reform efforts rest, they concluded, was "unreliable at best."
The Anatomy of a Gap
The mechanism behind the honesty gap is straightforward, though its implications ripple outward in complex ways. States have broad discretion in setting their own proficiency thresholds the score a student must achieve to be labeled "proficient" in a given subject. Some states set those thresholds high. Others set them considerably lower. The National Assessment of Educational Progress, administered by the National Assessment Governing Board, operates under its own definition: a student scoring at "proficient" on NAEP has demonstrated solid academic performance and competency over challenging subject matter.
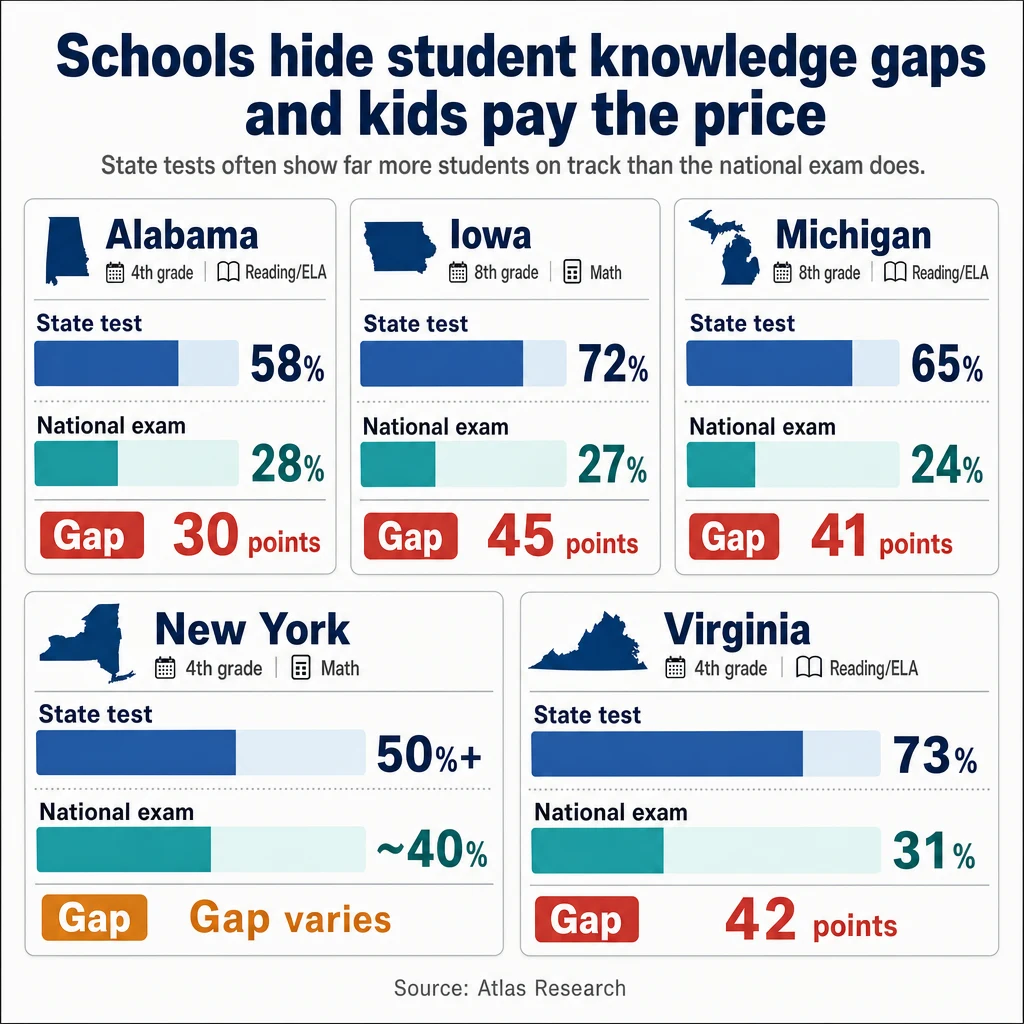
The collision between these two systems produces the gap. In New York, over half of fourth graders were deemed proficient in math on the state test in 2024 compared to less than 40 percent on NAEP. In Michigan, the contrast is even starker: 65 percent of eighth graders were proficient in reading according to the state exam, while just 24 percent cleared the same bar on the nation's report card. In Iowa, as noted, 72 percent of eighth graders passed state math while only 27 percent met the NAEP benchmark. The list goes on.
The Collaborative for Student Success has tracked these discrepancies year over year, producing state-by-state analyses that reveal patterns across the country. According to their most recent honesty gap analysis, only two states eliminated the gap entirely in the 2023-2024 school year. Massachusetts and Rhode Island closed their gaps to within five percentage points or less across both grades and subjects. But these are outliers. In most states, the divergence persists.
Virginia: A Case Study in Conflicting Standards
Few states illustrate the honesty gap more starkly than Virginia. According to 2024 NAEP data, only 31 percent of Virginia's fourth graders were proficient in reading and 40 percent in math on the national assessment. For eighth graders, the numbers were even lower: just 29 percent were proficient in both reading and math. Yet on Virginia's own Standards of Learning assessment, 73 percent of fourth graders were proficient in reading and 72 percent of eighth graders. In math, the 2024 SOL showed 71 percent of fourth graders proficient and 63 percent of eighth graders.
The Thomas Jefferson Institute for Public Policy, in an analysis of Virginia's standards, documented the implications: Virginia's "proficient" standards in reading on the SOL align to "below basic" on the national assessment. This means a failure to display even partial mastery of the knowledge and skills that are fundamental for work at grade level are deemed "proficient" using Virginia's standards. Virginia is one of only two states to have its "proficient" standard in reading align with "below basic" performance on the national assessment.
The disconnect is not accidental. It reflects policy choices about what words like "proficient" mean and who gets to decide. Robert Pondiscio, a senior fellow at the American Enterprise Institute, put the stakes plainly: "You will hear that NAEP 'proficient' is too high a bar and not a good proxy for the ability to read with comprehension. A fair point as far as it goes, but I defy you to find me a single parent comfortable with her child reading at 'below basic' level."
The Language Problem: Why Words Drift
At the heart of the honesty gap is a phenomenon that extends far beyond education policy. The same dynamic fluent language masking inaccuracy appears wherever words carry more weight than verified constraints. In a research paper from GenXis Research, analysts Daryl Ledyard and Philip Tyler describe this as "the squishiness of words": language that can preserve signal but can also metabolize error into something that sounds reasonable.
The GenXis framework draws an explicit parallel between human communication and machine output. In both domains, the danger comes from the mismatch between linguistic confidence and verified grounding. Natural language is flexible by design it allows approximation, metaphor, implication, emphasis, ambiguity, and context dependence. Those features make language humanly useful, but they also make it a weak carrier of certainty.
"A sentence can feel precise while remaining logically incomplete," the GenXis paper notes. "Each may be true, false, evasive, or meaningless depending on hidden definitions. What counts as responsible? Which model? What evidence? Which circumstances?" Informally, people now use words such as vibes and slop to describe language that feels meaningful while carrying weak constraint.
In education, the verbal drift manifests as shifting definitions of proficiency. A state might lower its threshold for "proficient" to reflect local conditions, economic pressures, or political realities. The word stays the same. The meaning changes. Parents reading a report that says their child is "proficient" assume they understand what that means but the assumption rests on a shared vocabulary that no longer shares the same content.
A Head-to-Head Comparison: State Standards vs. National Benchmarks
The most effective way to understand the honesty gap is to see it side by side. Below is a comparison of state-reported proficiency rates against NAEP results for a selection of states, drawn from the Collaborative for Student Success analysis and NAEP data:
| State | Grade | Subject | State Test Proficiency | NAEP Proficiency | Gap |
|---|---|---|---|---|---|
| Alabama | 4th | Reading/ELA | 58% | 28% | -30% |
| Iowa | 8th | Math | 72% | 27% | -45% |
| Michigan | 8th | Reading/ELA | 65% | 24% | -41% |
| New York | 4th | Math | 50%+ | ~40% | Varies |
| Virginia | 4th | Reading/ELA | 73% | 31% | -42% |
The pattern is consistent across the country: state assessments, on average, report higher proficiency rates than NAEP. Some of this reflects genuine differences in student populations, curricular alignment, or test design. But the scale of the discrepancies gaps of 30, 40, even 45 percentage points points to something structural rather than statistical. The definitions themselves differ.
The Pandemic's Role in Widening the Gap
The honesty gap did not emerge in a vacuum, and its trajectory has not been linear. Writing for the Thomas Jefferson Institute, analyst Dale Chu observes in a Fordham Institute commentary that "compounding the problem is rampant grade inflation, which only got worse during the pandemic and has since widened both performance and attendance gaps." The disruptions of 2020 and 2021 accelerated trends that were already in motion. As Chu notes, "the disconnect between what students are learning and how their progress is reported grows wider."
Some states have moved to close the gap. Virginia, under Republican Gov. Glenn Youngkin, drew attention to the honesty gap in 2022, announcing sweeping changes to the state's testing regimen that include stricter standards, assessments, and cut scores. The state redesigned its school accountability and accreditation system, committed significant funding to high-dosage tutoring and literacy programs, and began a deliberate process of aligning state definitions with national benchmarks. The changes are not without controversy some critics argue the new system creates a negative perception of schools in order to promote private school choice but the direction is clear: toward greater transparency.
Oklahoma took a different path. In 2017, Superintendent Joy Hofmeister raised proficiency scores to be closer to the NAEP standard. "The whole idea was trying to get an honest indicator of student readiness as early as third grade when kids start testing," said Maria D'Brot, a former deputy superintendent. Scores fell sharply. The change was "wildly unpopular and demoralizing," according to Richard Cobb, superintendent of the Mid-Del District. Now, under Superintendent Ryan Walters, the bar is lower and the scores are higher but the honesty gap has widened accordingly.
The Accountability Question
Behind the numbers lies a fundamental question about what education is for. If states set their own proficiency standards, and those standards vary widely, how can employers, colleges, or policymakers compare students across state lines? How can parents make informed choices about their children's education when the terminology they rely on means different things in different places?
The Fordham Institute analysis frames this as a breach of public trust. "This isn't merely a technical flaw," Chu writes; "it's a glaring failure of accountability." The challenge ahead is clear: reconciling the need for transparency and rigor with skepticism toward the very systems meant to ensure both.
Business leaders have a particular stake in this question. Declining student achievement limits the talent pipeline and threatens economic vitality. Inflated proficiency rates can mask learning gaps, misallocate resources, and leave students unprepared for the workforce. As the U.S. Chamber of Commerce Foundation brief notes, business leaders are uniquely positioned to champion high expectations and hold policymakers accountable for the accuracy of the data they produce.
What Mathematical Grounding Offers
If the problem is verbal drift the squishiness of words that allows the same term to carry different meanings in different contexts then the antidote is not less language, but stronger grounding. The GenXis Research paper argues for mathematical constraint: deterministic checks, calibrated abstention, and evidence memory. These are principles developed in the context of artificial intelligence systems, where the concern is that "machines can be wrong in fluent, reasonable, socially persuasive language." But they apply equally to education data.
NAEP provides one such mathematical anchor. Because it uses consistent definitions, consistent administrations, and consistent scoring across states, it allows for apples-to-apples comparison. A score of 250 on NAEP means the same thing in Alabama that it means in Wyoming. State assessments, by contrast, are calibrated differently their scores reflect state-specific standards, which may be higher or lower than the national baseline.
The distinction matters because it determines what kind of certainty a number can carry. As the GenXis framework puts it, a claim is not merely a sentence. It is a tuple where the statement, the domain, the truth condition, and the evidence requirement are all specified. Without those elements, language remains expressive but under-bounded it may point toward a reality without specifying the procedure by which that reality is checked.
This is why the honesty gap is not merely a reporting discrepancy. It is an epistemological problem. When the word "proficient" means different things in different contexts, it becomes a container that can hold whatever meaning is most convenient. The numbers may be accurate by one definition and wildly misleading by another. Mathematical grounding standardized benchmarks, verifiable procedures, consistent definitions provides the anchor that prevents verbal drift.
Why This Matters for GenXis Research Readers
The honesty gap is not only an education story. It is a case study in a problem that appears across every domain where language carries consequences: legal drafting, medical triage, scientific writing, financial reporting, and as GenXis Research has documented extensively artificial intelligence. The same dynamic that allows a state to report 73 percent proficiency while NAEP reports 31 percent allows an AI system to generate a legal citation in perfect legal prose while fabricating the case name, or to produce a medical explanation that sounds clinically plausible while omitting a critical contraindication.
The principles that expose the education honesty gap comparison against standardized benchmarks, insistence on verifiable definitions, resistance to verbal drift are the same principles that expose AI hallucinations. In both cases, the danger comes from the mismatch between linguistic confidence and verified grounding. Understanding one helps illuminate the other.
For readers researching frameworks, standards, and ideas, the honesty gap offers a concrete example of what happens when language is not anchored to mathematical constraint. It demonstrates why fluency alone is insufficient why persuasive, confident language can mask deep inaccuracies unless it is tethered to something verifiable. And it points toward a solution: stronger standards, consistent definitions, and the discipline to compare claims against external benchmarks rather than accepting them at face value.
Where to Read Further
The sources below offer deeper dives into specific aspects of the honesty gap. The U.S. Chamber of Commerce Foundation brief provides the most comprehensive overview of state-by-state discrepancies and their implications for business leaders. The Collaborative for Student Success analysis offers the latest data and methodology behind the gap calculations. For a theoretical framing that connects verbal drift in education to broader questions about language, AI, and verification, the GenXis Research paper on words versus math situates the honesty gap within a larger landscape of epistemological challenges in automated systems.